Convey Advanced Reporting Overview - IM
Convey Advanced Reporting Overview
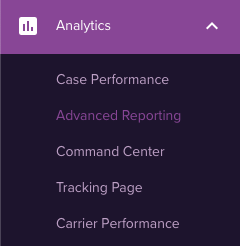
Ingram Micro needs the ability to report on key business metrics provided via the Convey Platform in order to support operational workflows and provide management visibility. To provide these key capabilities, Convey combines carrier data and customer data in order to power a collection of Advanced Reports found here: https://app.getconvey.com/analytics/advanced
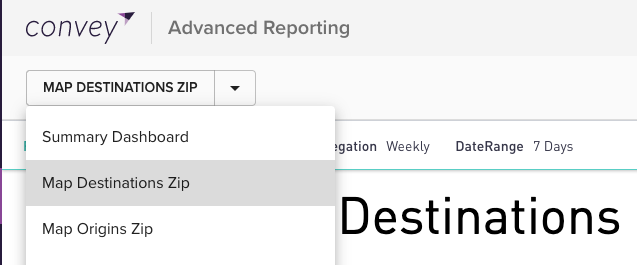
Twenty reports are available within the Advanced Reporting section and updated on a daily basis at 8 am CDT. These reports are accessible through the drop-down on the top-left:
Basic Functionality
All reports include filters on the top of the page:
The specific fields available for filters change on a per report basis (more details below).
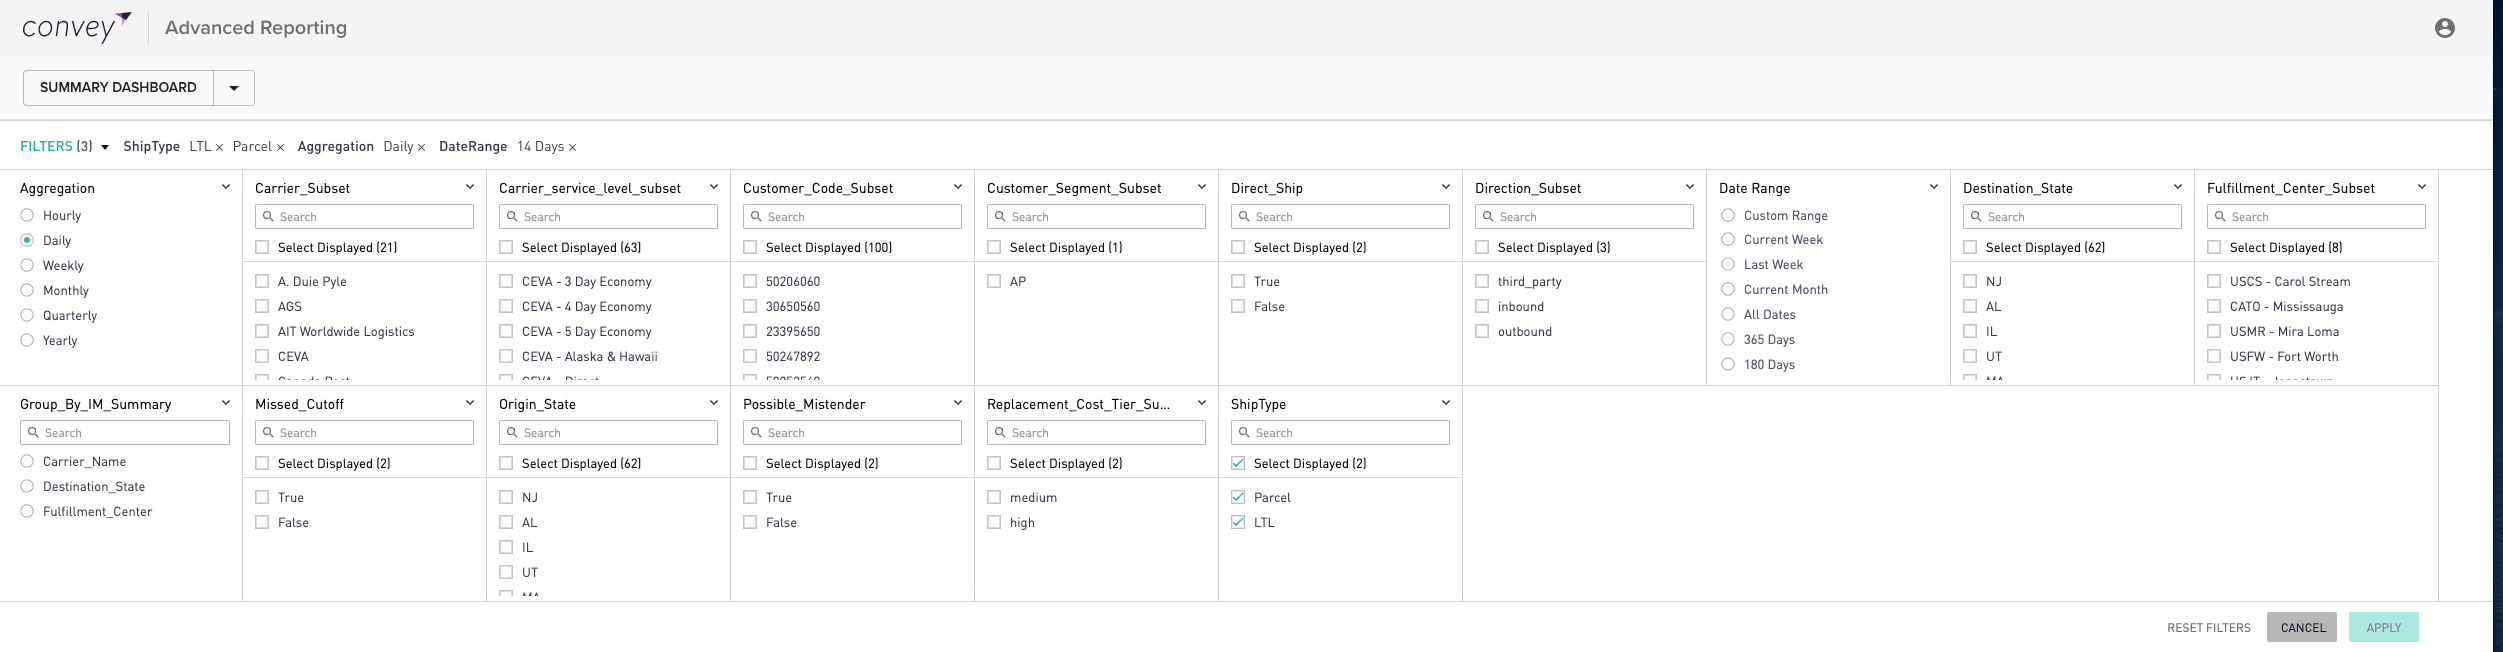
All reports have at least a Shipment Type (Parcel/LTL), Date Range, Aggregation (Daily/Weekly/Monthly), and Carrier_Subset filter available.
Remember to apply the filters for changes to be visible in the report below
Filtering within a visualization will only change the data in the specific view and not the sections below.
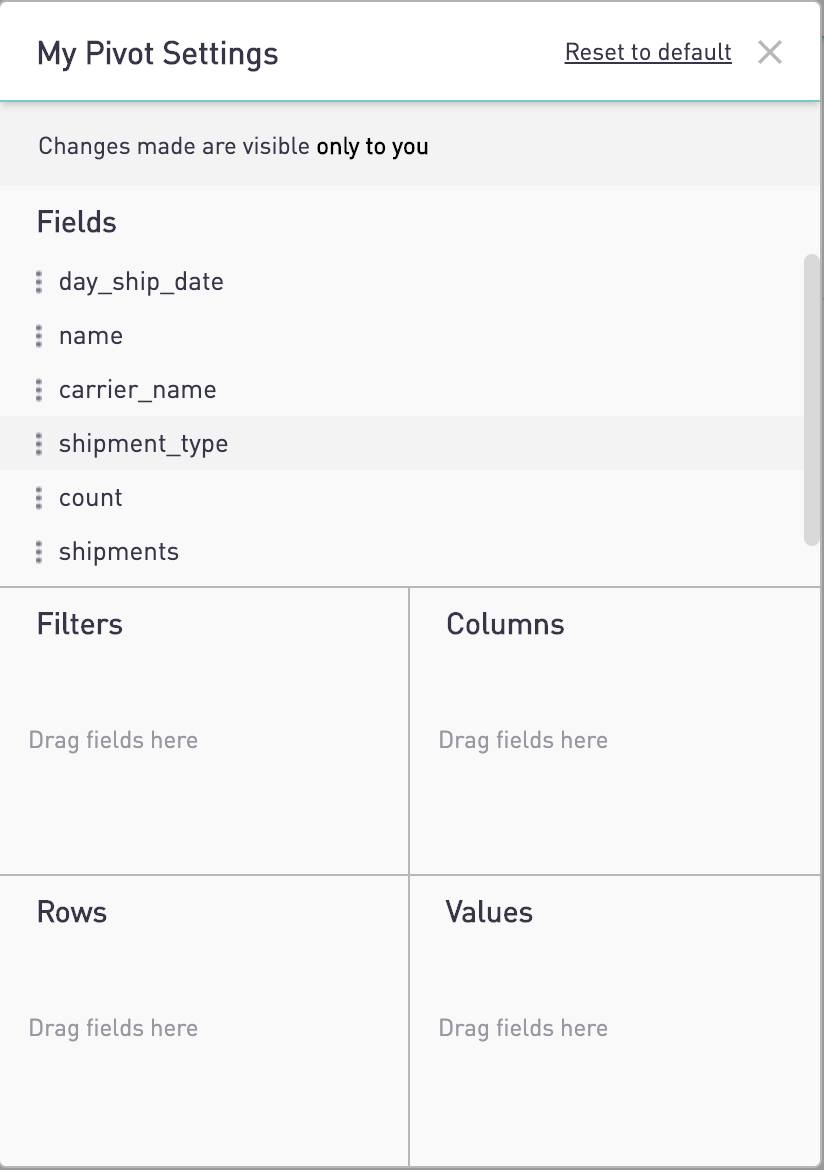
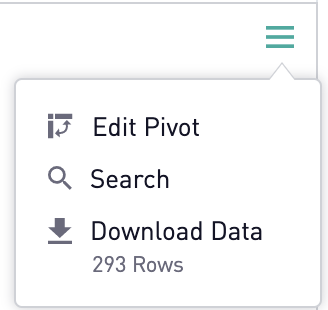
Pivot functionality is available on all tables by clicking on the hamburger menu in the top right of the view:
Summary Dashboard
The overview dashboard provides a snapshot of shipments and exceptions in Convey.
Metrics are divided across Delivered, In-Transit, and Return-To-Sender.
Return-To-Sender and Delivered-To-Sender metrics are based on the Convey status as determined from carrier data.
Additionally metrics are provided for Stalled Shipments* using the following criteria:
- Shipment is not predicted to miss an estimated delivery date
- Estimated Delivery Date from the carrier is not in the past
- Shipment is not inbound
- Shipment is not in RTS status
*Stalled Shipments displayed in the dashboard are different from the “No-Movement” filter in the Convey All Shipments page.
Aggregated Reports
|
Reports |
Description |
|
Map Destinations Zip |
Provides a map view of the top ten destination zip codes with the highest volume |
|
Map Origins Zip |
Provides a map view of the top ten origin zip codes with the highest volume |
|
Map Destinations City |
Provides a map view of the top ten destination cities with the highest volume |
|
Map Origins City |
Provides a map view of the top ten origin cities with the highest volume |
|
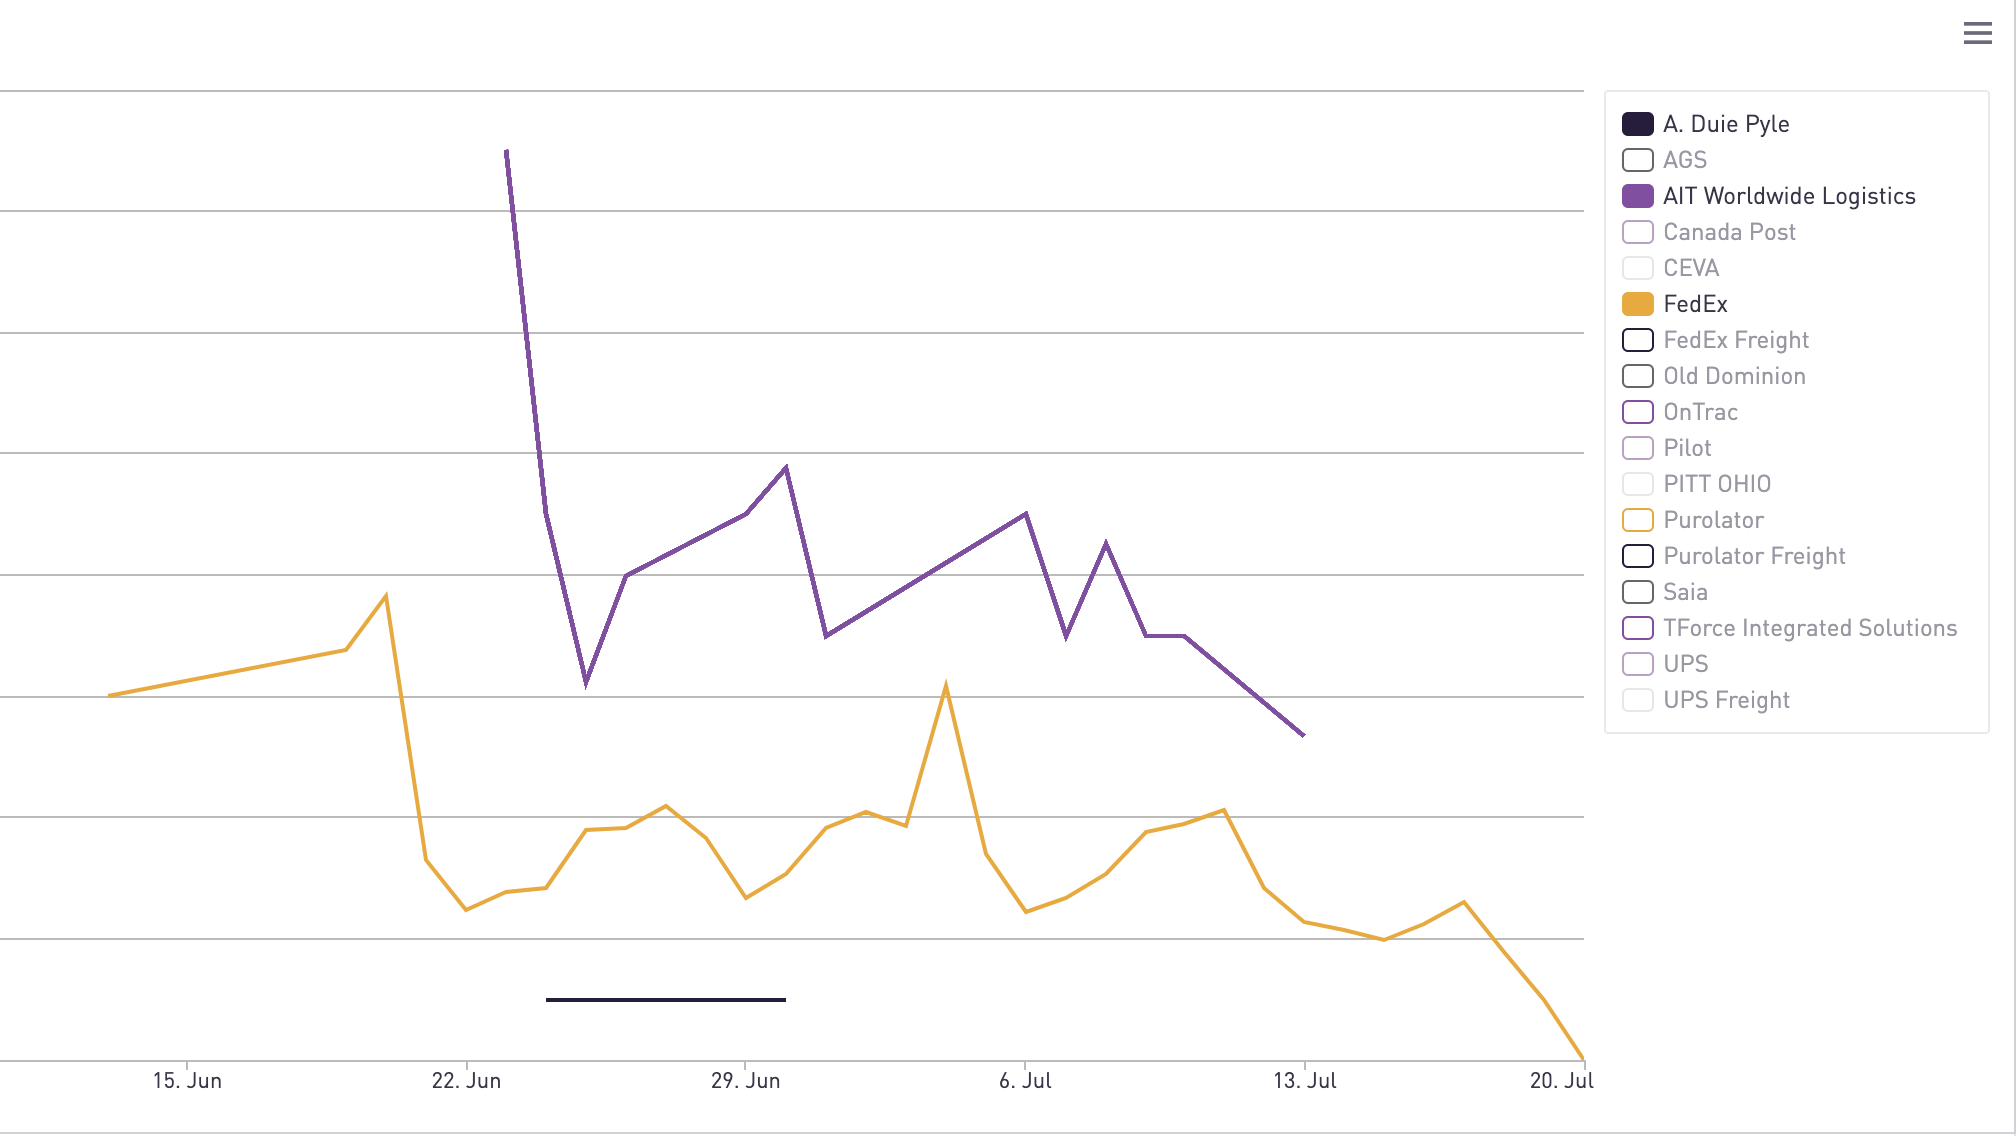
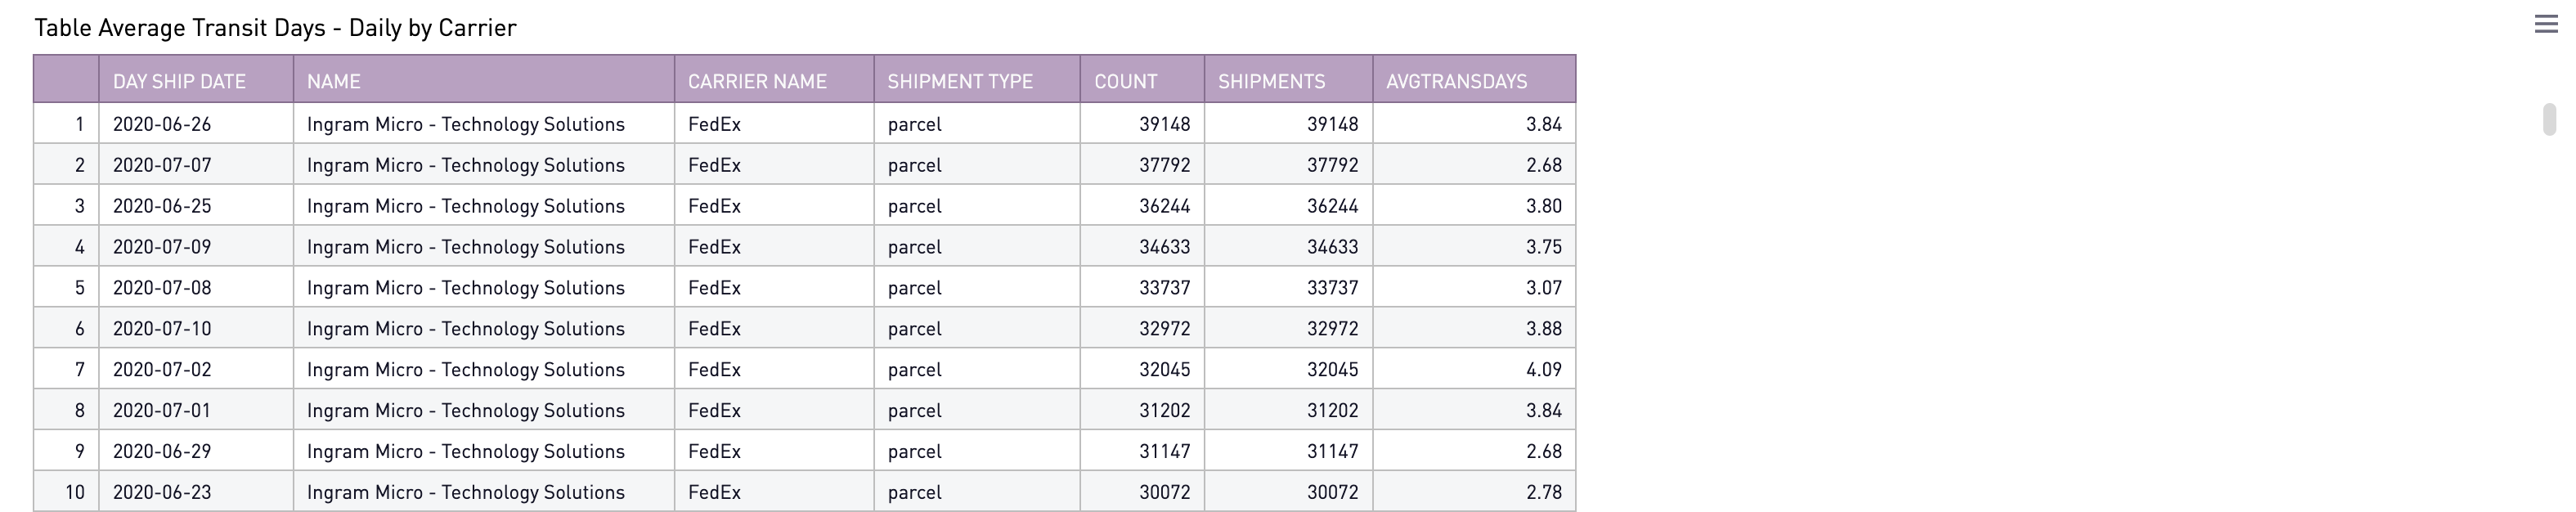
Average Transit Time |
Calculates the average transit time based on the difference between carrier reported ship date and delivered date on a per carrier basis |
|
Exception Rate |
Calculates the exception rate as a percentage of shipments that have at least one exception broken out by Carrier. |
|
Exception Volume |
Displays exception volume by carrier. Group by filter is available for more visualization options (see Group by Filter section below) |
|
Exception Location |
Displays exception volume based on where the carrier reported the exception occurred. |
|
Exception Rate by Location |
Calculates the exception rate based on either the origin or destination locations. |
Aggregated Reports with Detail Views
The following reports include specific filters to allow for downloading of detail rows:
|
Reports |
Description |
|
Shipments by Created Date |
Displays shipment volume by day they were ingested into the Convey system. |
|
Shipments by Ship Date |
Displays shipment volume by the carrier reported ship date for each shipment. |
|
Shipments by Delivered Date |
Displays shipment volume by the carrier ingested delivered data for each shipment. |
|
Shipments by Forecasted Delivery Date |
Displays shipment volume by the carriers estimated delivery date for each shipment. |
|
On-Time Delivery - EDD |
Calculates the On-Time Delivery rate for carriers based on the original estimated delivery date provided by the carrier. |
|
On-Time Delivery - Promise |
Calculates the On-Time Delivery rate for carriers based on the retailer promised date. |
|
% of Shipments with EDD |
Calculates the percentage of shipments that have estimated delivery date provided by the carrier. |
|
% of Shipments with EDD Revisions |
Calculates the percentage of shipments that receive a revised estimated delivery date by the carrier. |
The total number of pages to export will be shown as well as the number of rows based on the global filter criteria that is applied.
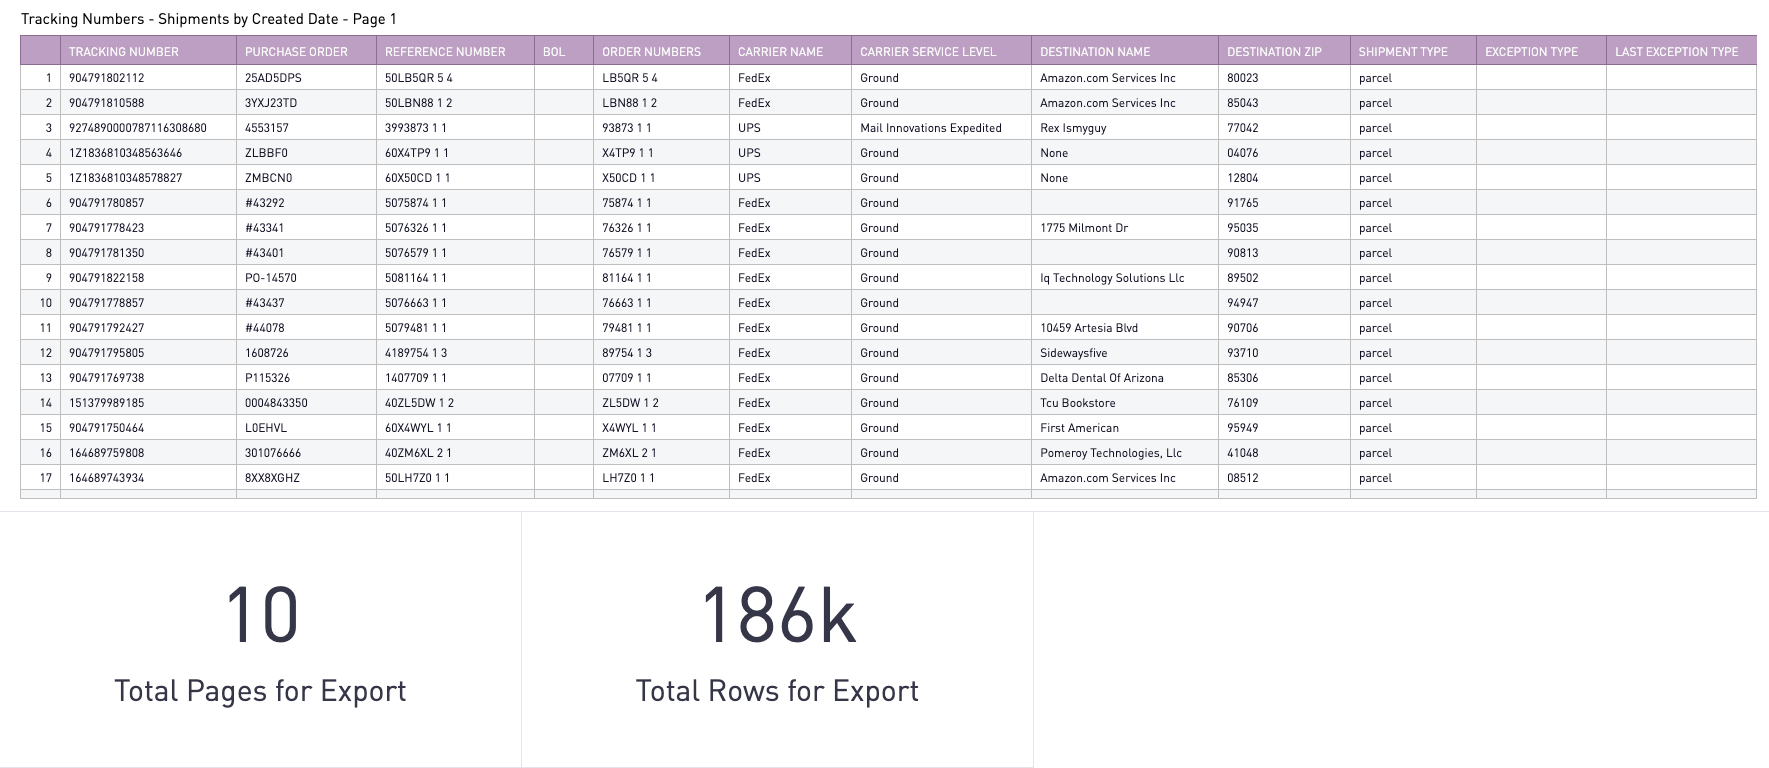
Use PageFilter_IM to change the pages displayed in the detail section, the Page number will be displayed in the title of the export section:

Download the data through the hamburger menu on the top right of the view:
Benchmark Reports
|
Reports |
Description |
|
Benchmark Exception Rate |
Calculates the Exception Rate for your carriers against network data available for those same carriers across Convey customers. |
|
Benchmark Exception Trend |
Displays the trend for Exception Rate for your carriers against network data available for those same carriers across Convey customers. |
|
Benchmark On-Time Delivery EDD |
Calculates the On-Time Delivery for your carriers against network data available for those same carriers across Convey customers. |
Group by Filters
The following reports allow the visualization to be grouped by a small subset of fields.
|
Report |
Grouping Filter Available |
|
Summary Dashboard |
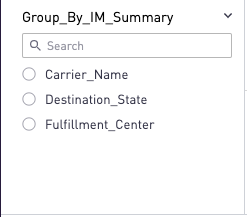
Group_by_IM_Summary - Visualization can be changed to be grouped by Destination_State, Fulfillment_Center, or Carrier |
|
Shipments by Created Date |
Group_by_IM_Summary - Visualization can be changed to be grouped by Destination_State, Fulfillment_Center, or Carrier |
|
Shipments by Ship Date |
Group_by_IM_Summary - Visualization can be changed to be grouped by Destination_State, Fulfillment_Center, or Carrier |
|
Shipments by Delivered Date |
Group_by_IM_Summary - Visualization can be changed to be grouped by Destination_State, Fulfillment_Center, or Carrier |
|
Shipments by Forecasted Delivery Date |
Group_by_IM_Summary - Visualization can be changed to be grouped by Destination_State, Fulfillment_Center, or Carrier |
|
Exception Volume |
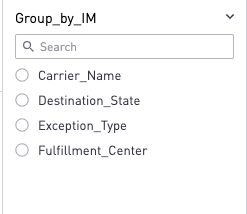
Group_by_IM - Visualization can be changed to be grouped by Destination_State, Exception Type, Fulfillment_Center, or Carrier |
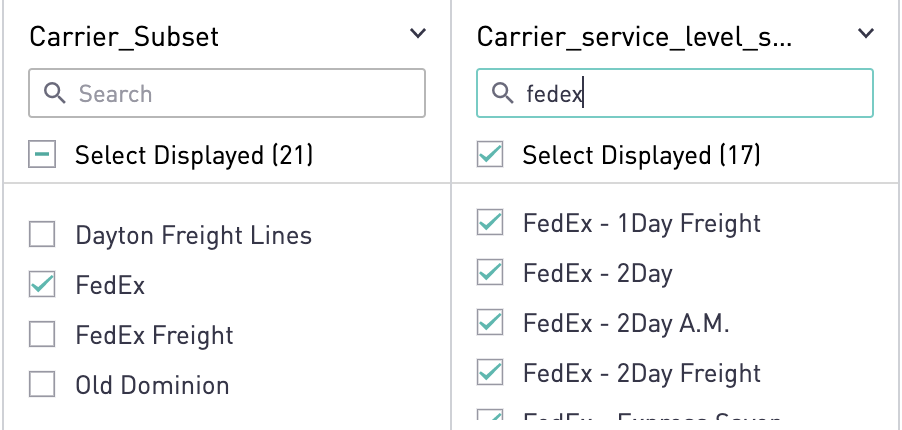
Carrier & Carrier Service Level Filters
When filtering on the Carrier Service level, the carrier_subset filter should be applied first to ensure accuracy.
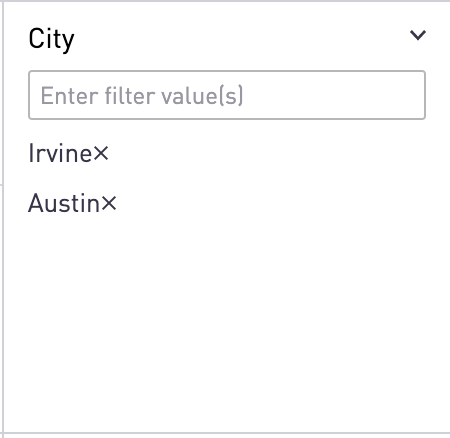
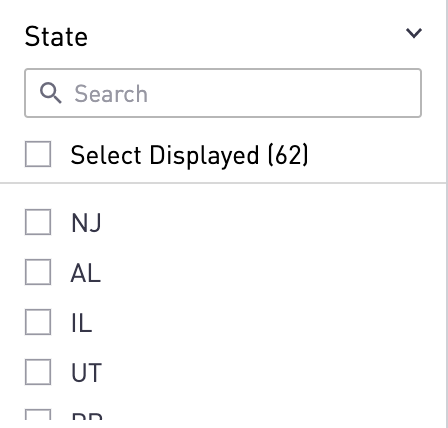
City & State Filters
For the Exception Volume and Exception Location reports, two additional location filters are available. These filters should be used to filter on the location where the exception occurred as reported by the carriers. The City filter is a free form filter and multiple cities can be chosen as shown in the example below: